
ATHX 2026: Worldwide Performance Benchmarks
Discover what ATHX performances look like worldwide. Explore 11,063 real results across 13 divisions, covering strength, endurance and functional conditioning.


Curious what ATHX performances look like around the world?
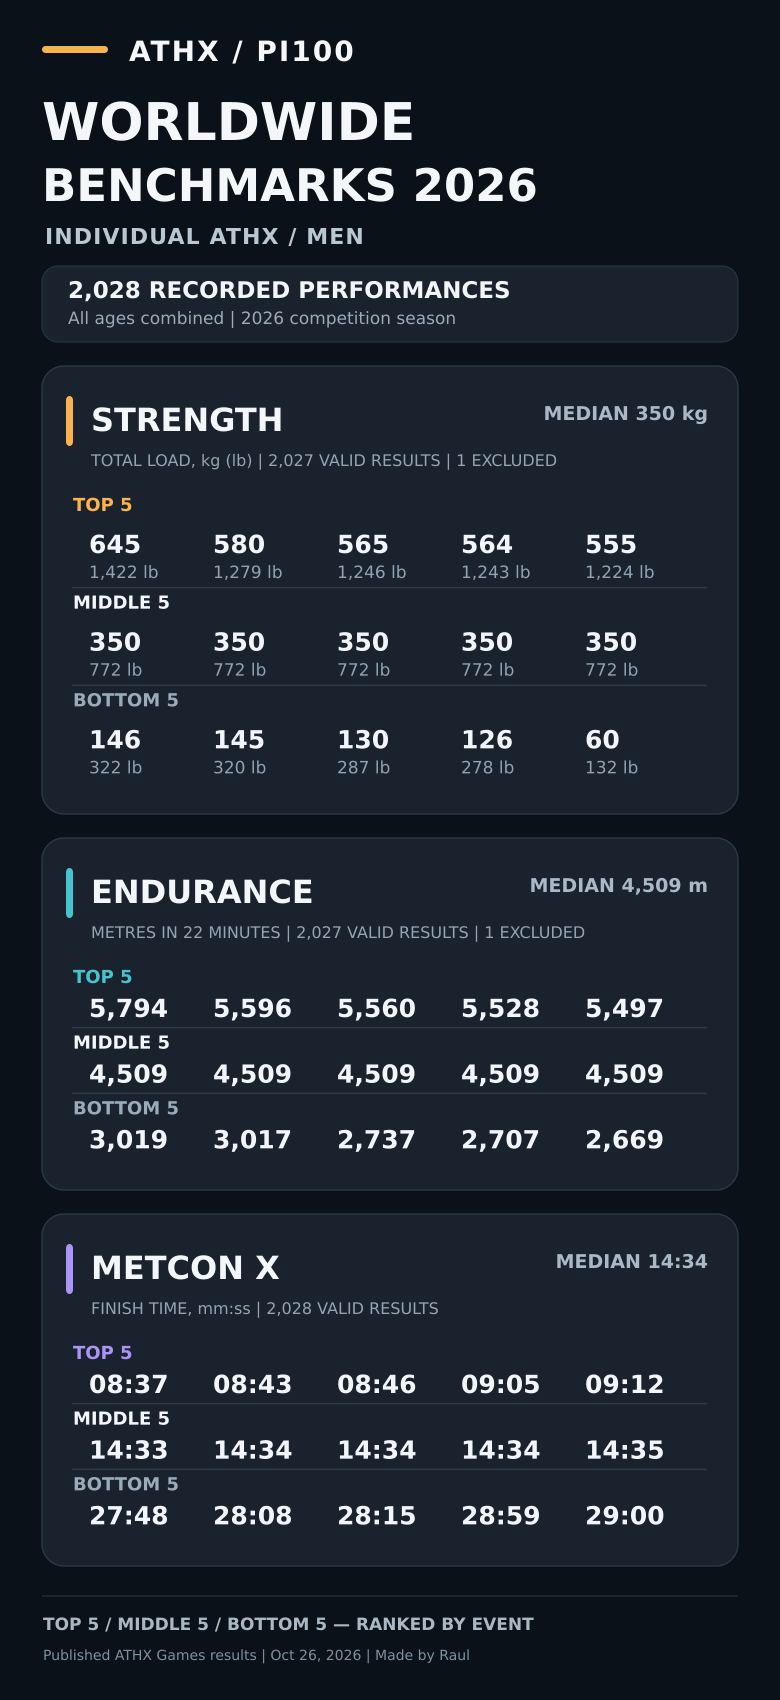
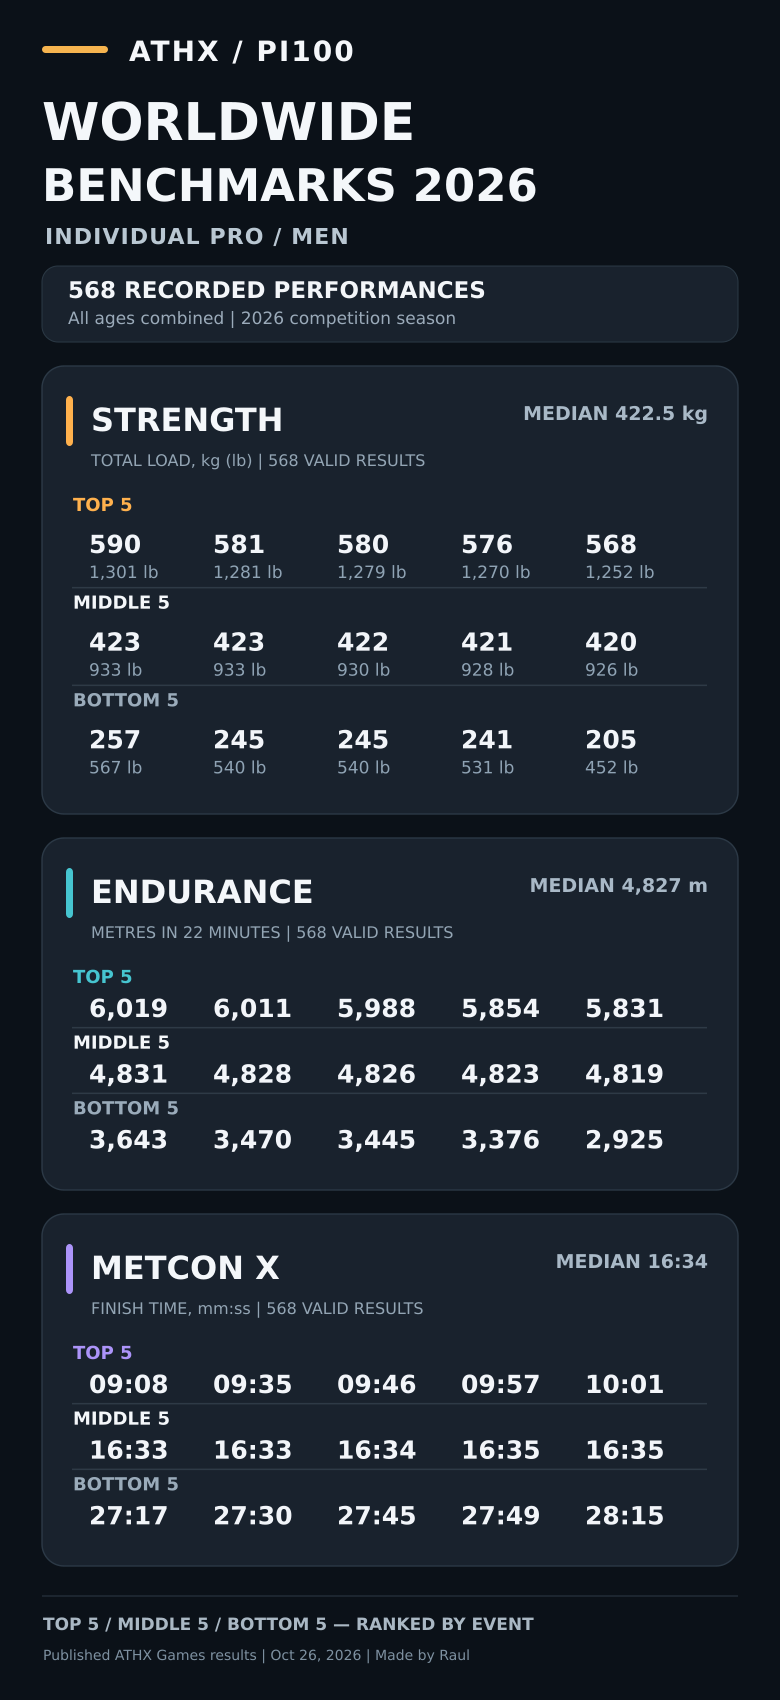
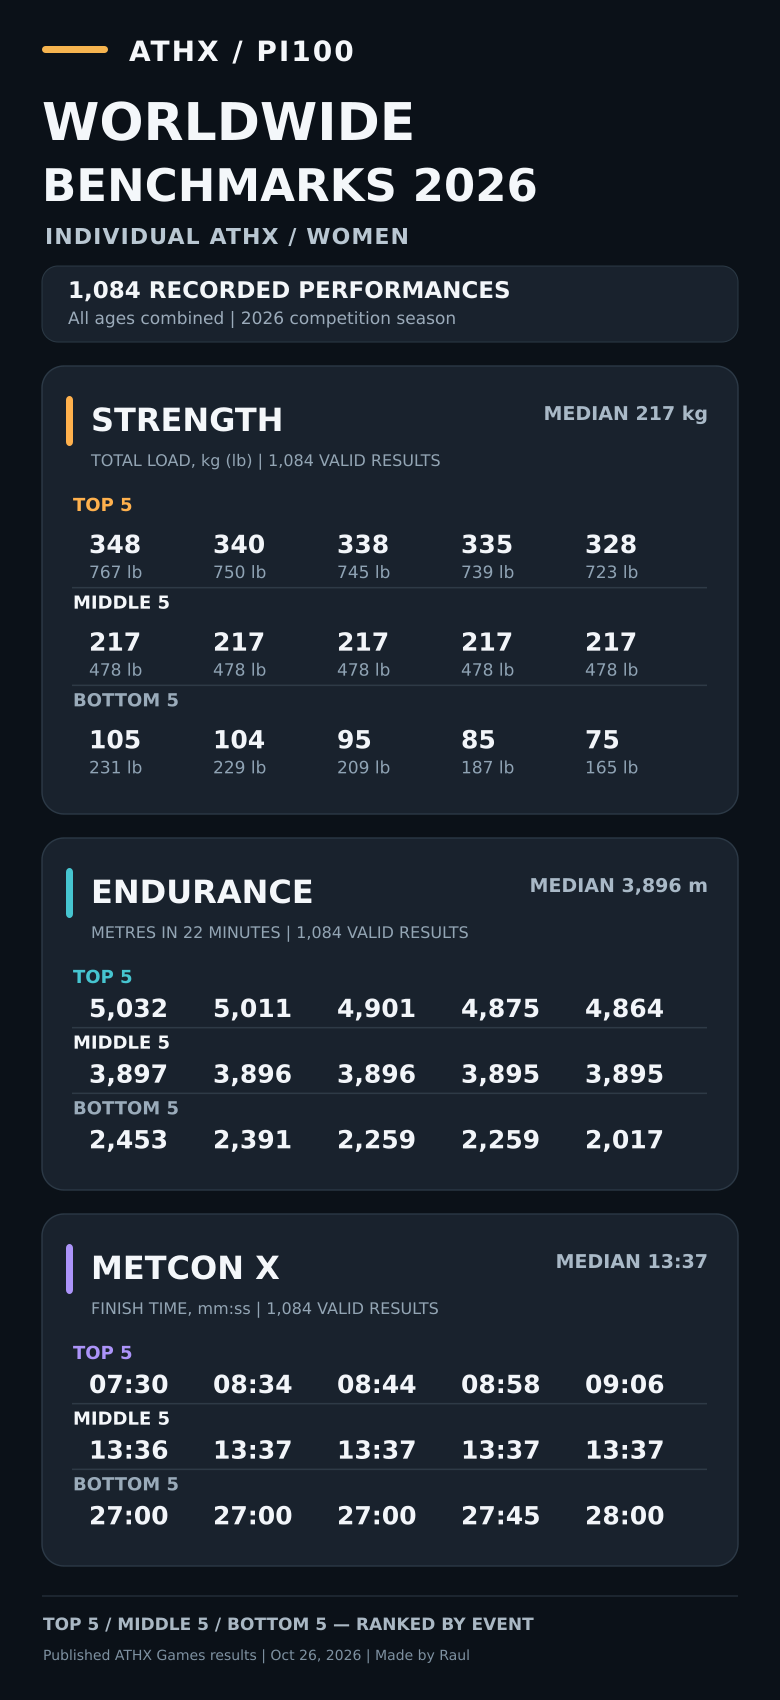
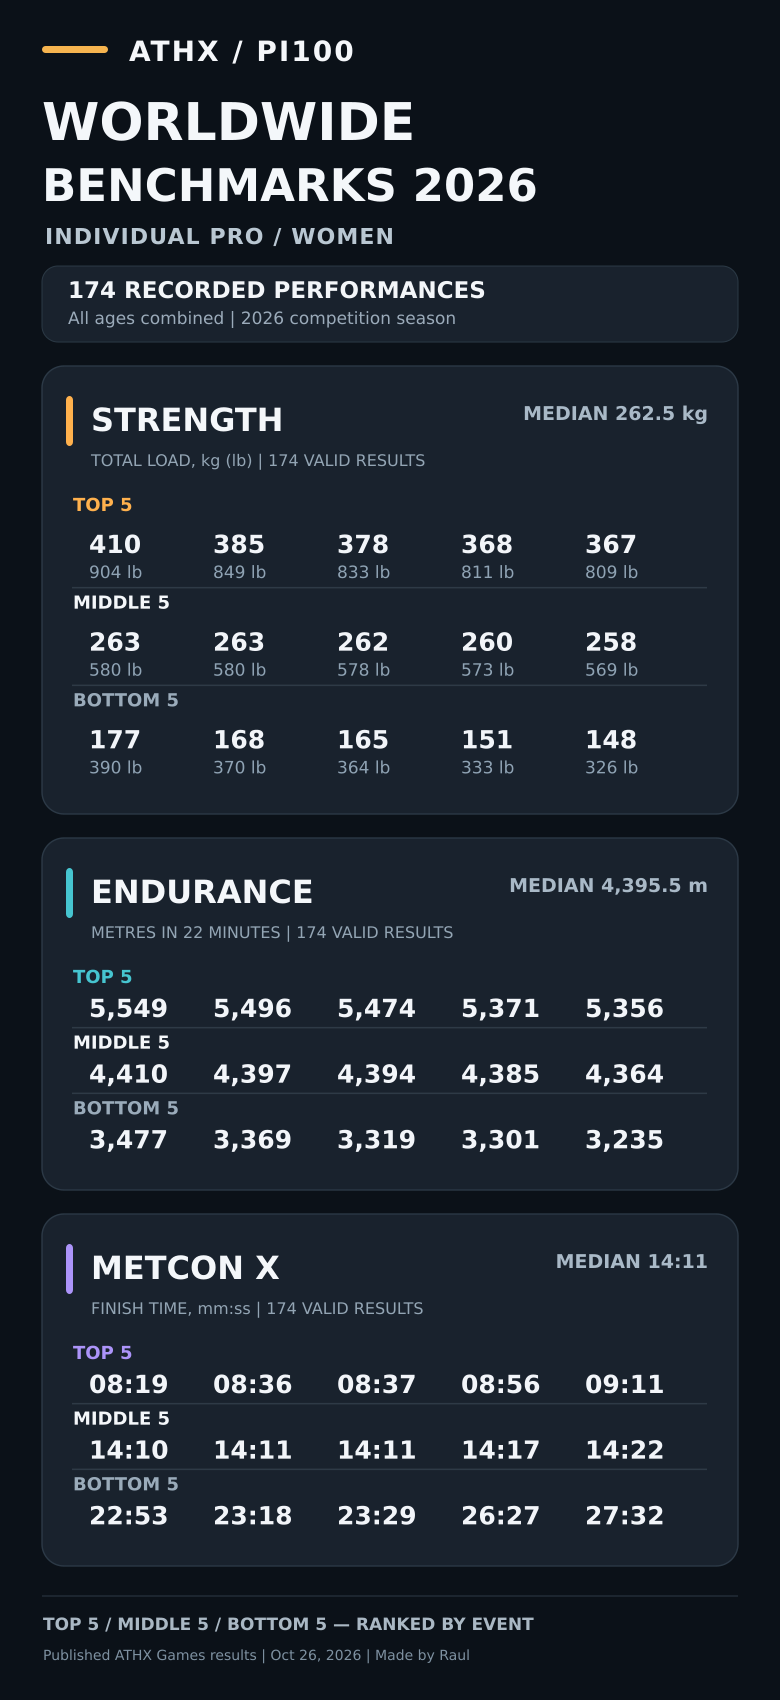
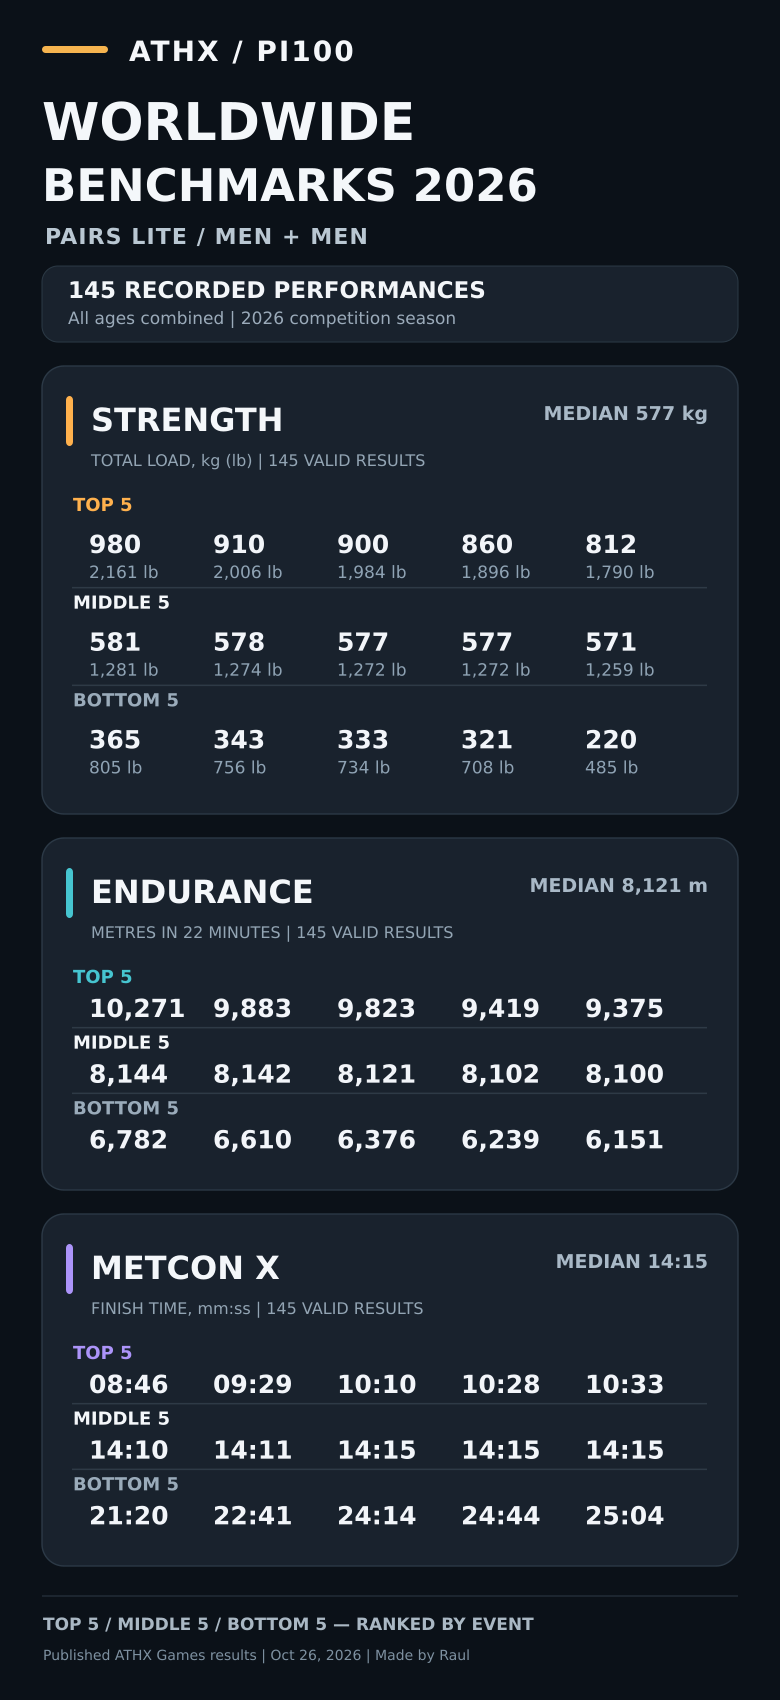
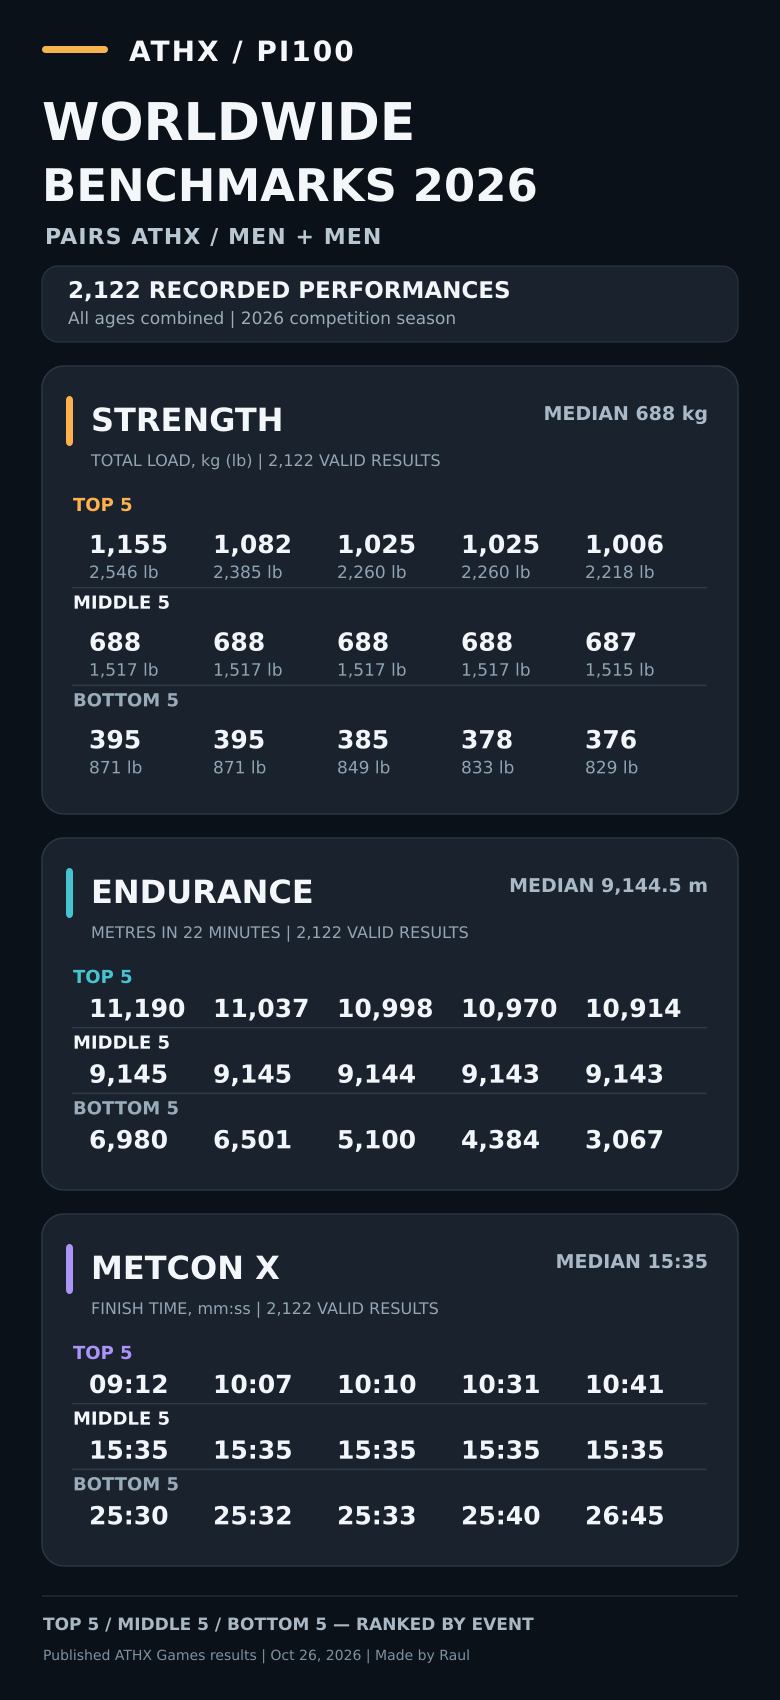
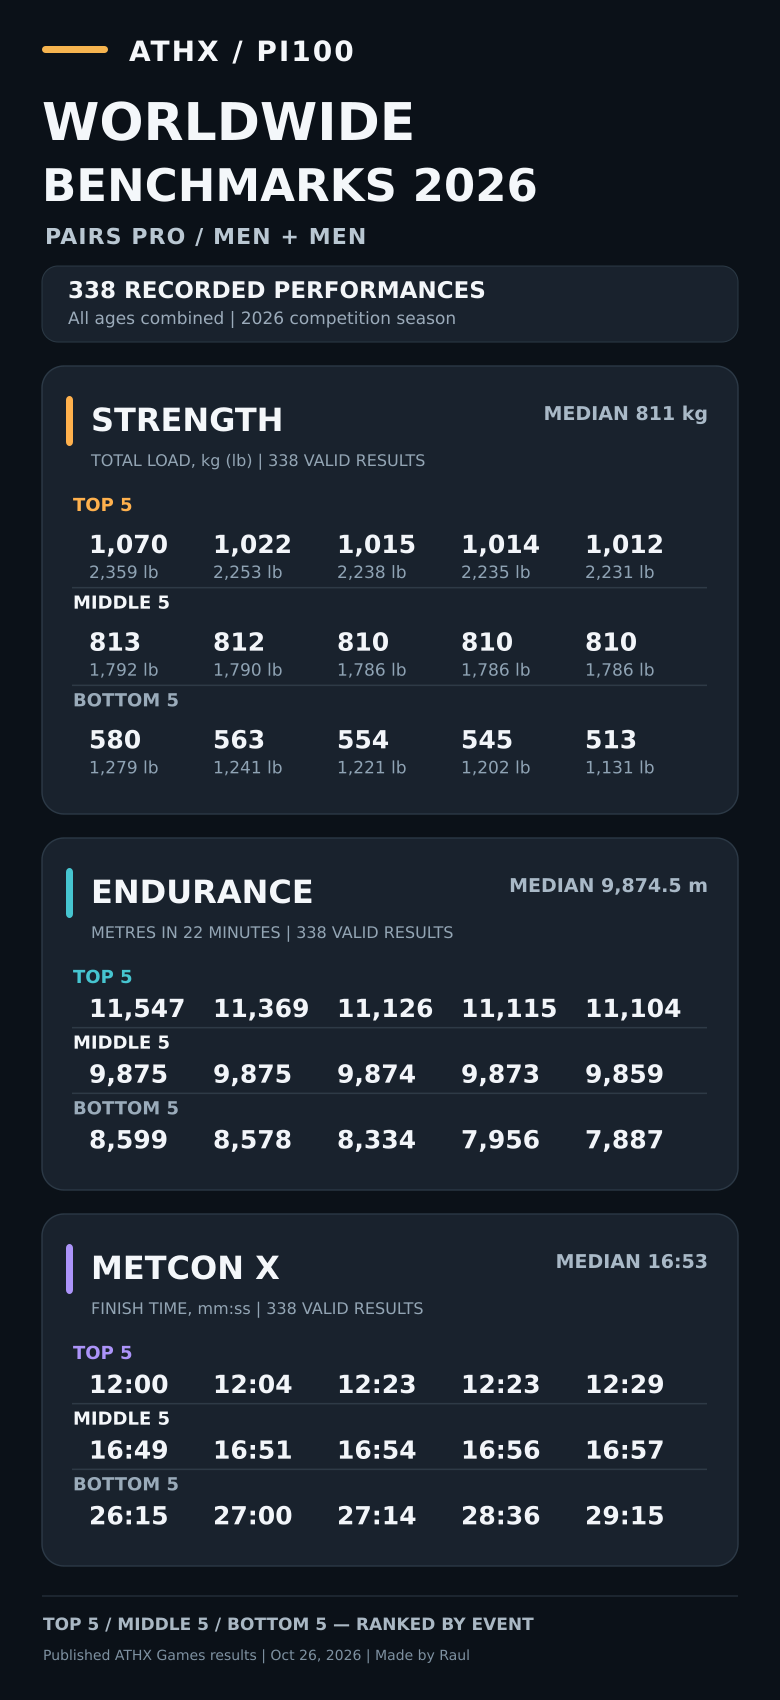
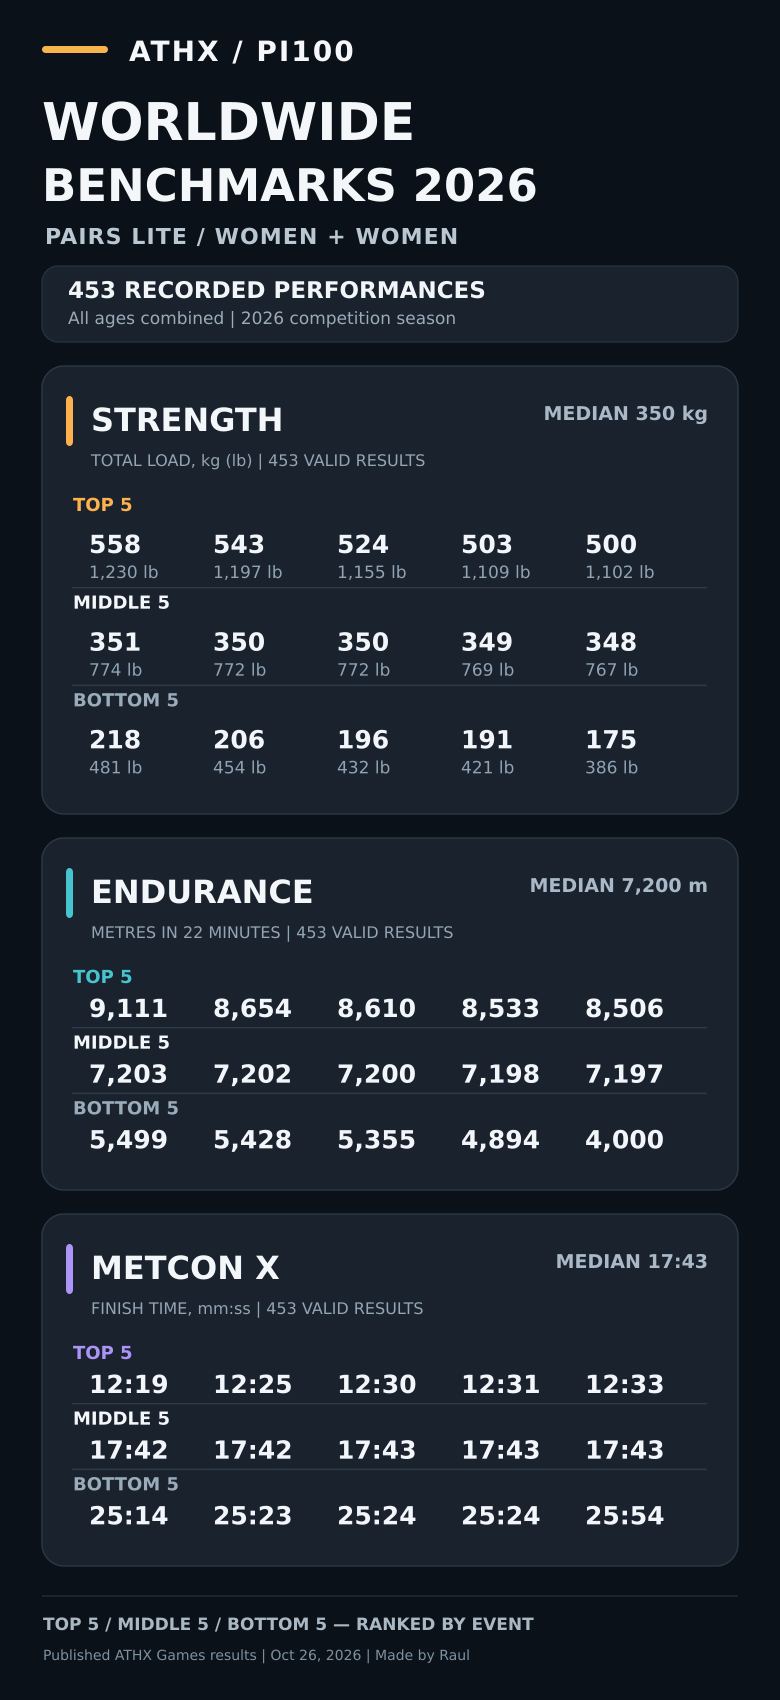
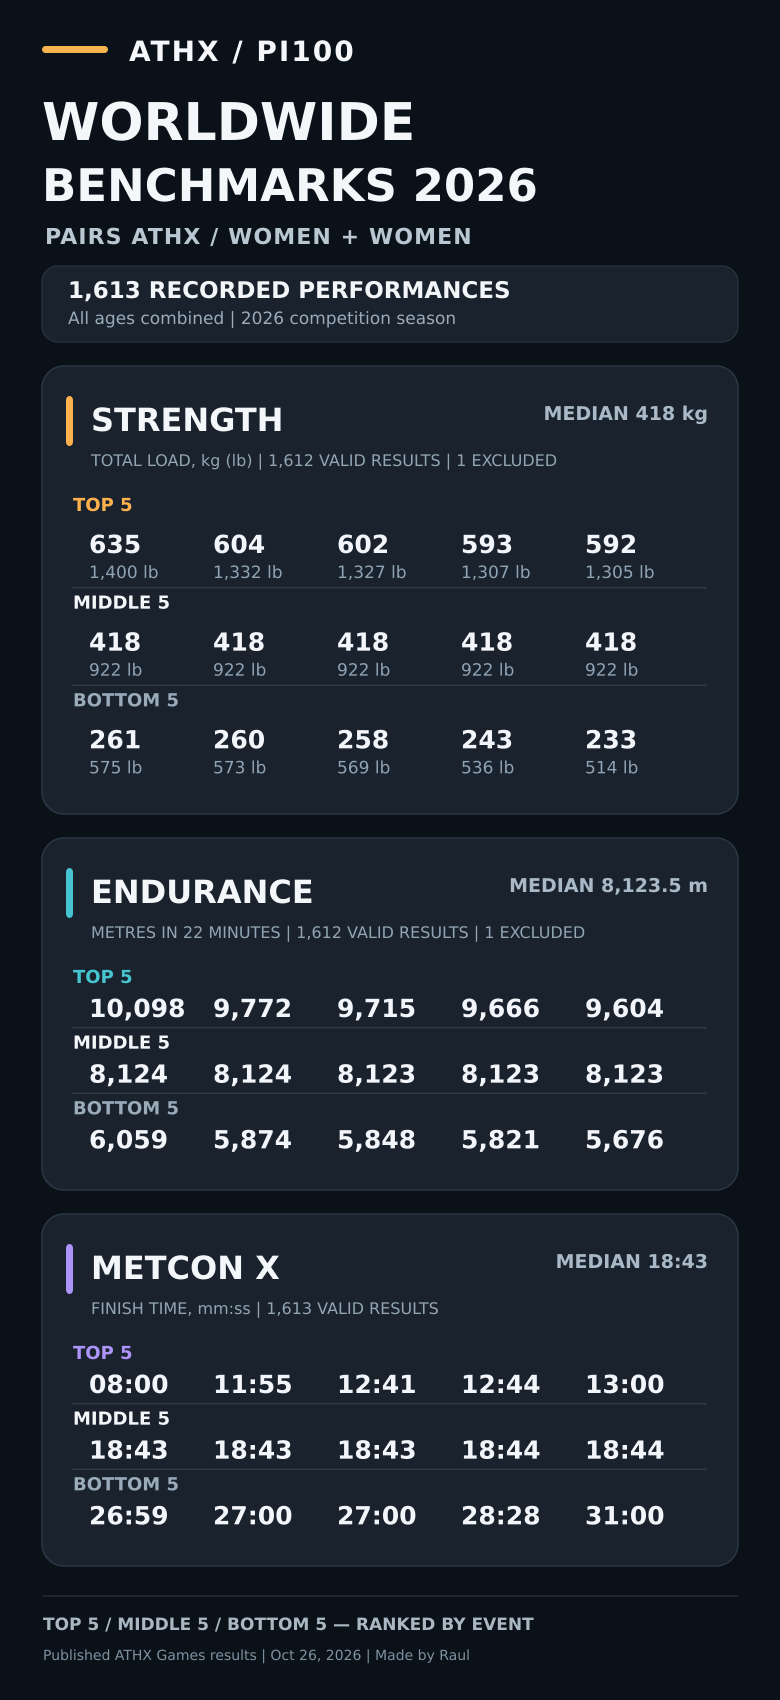
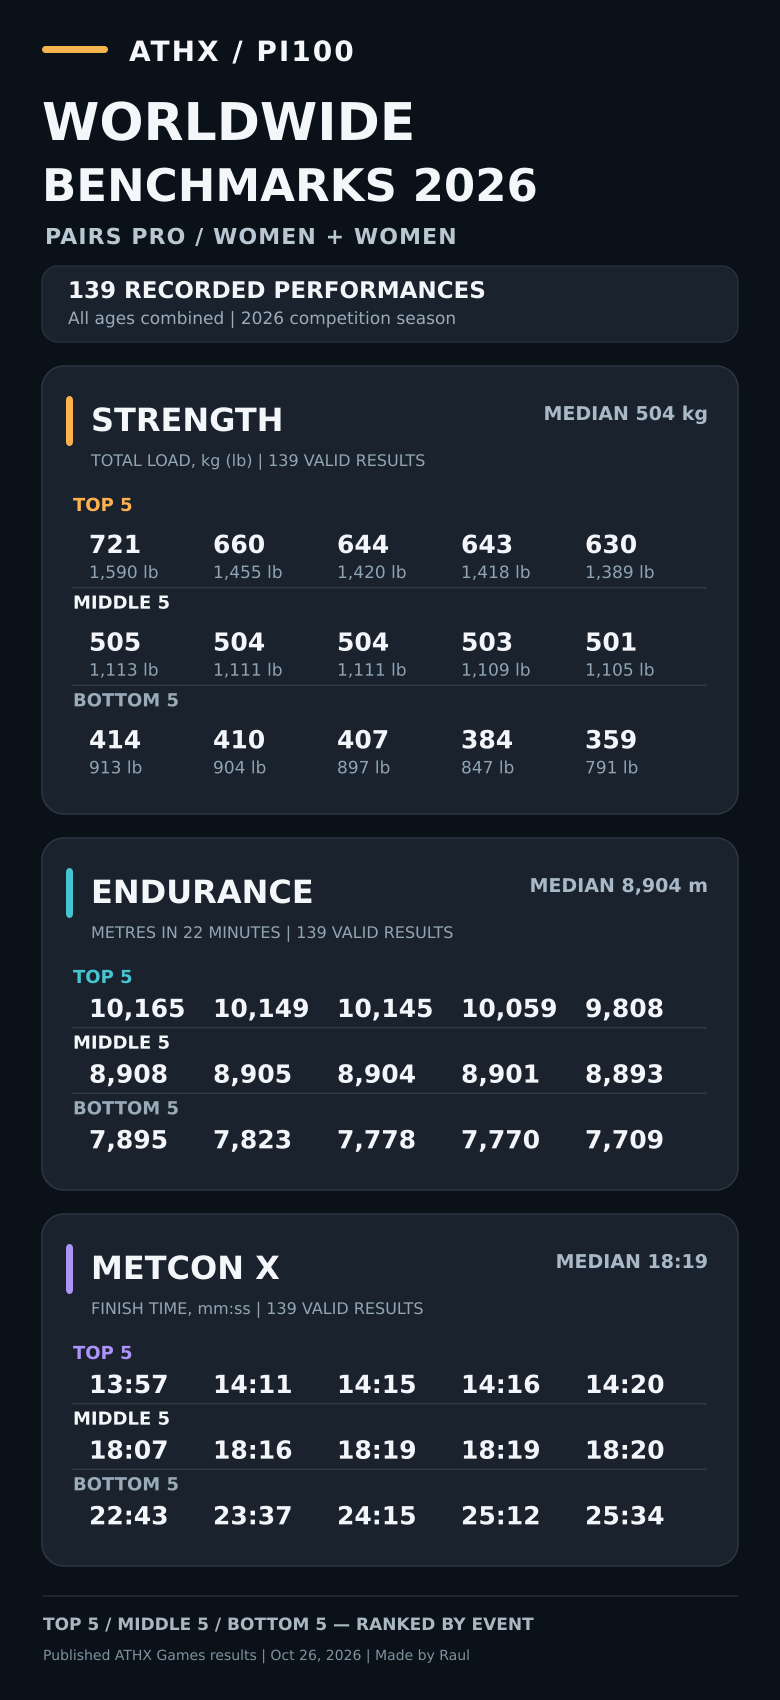
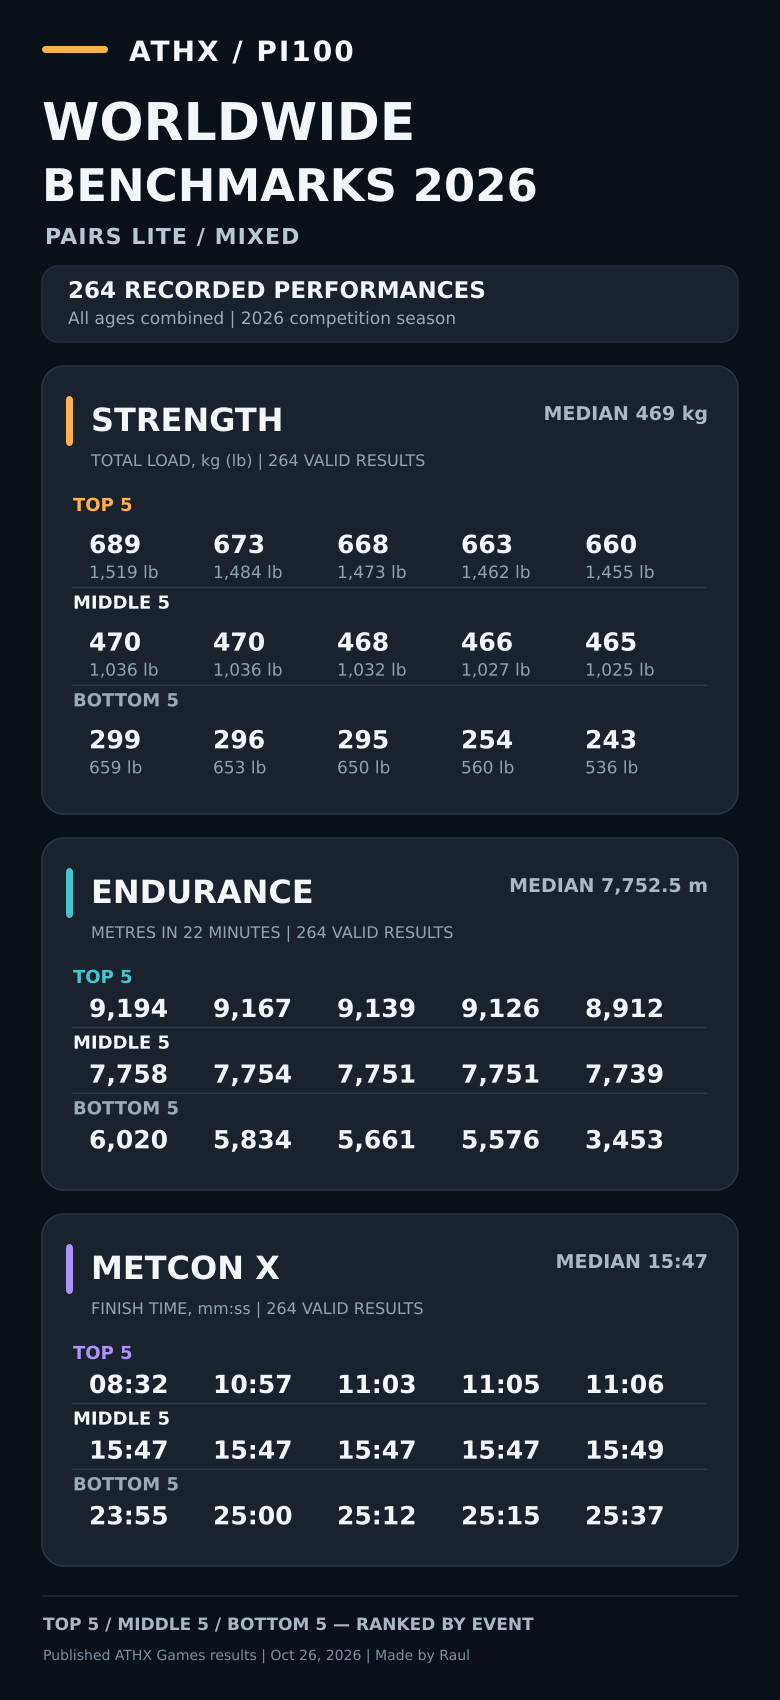
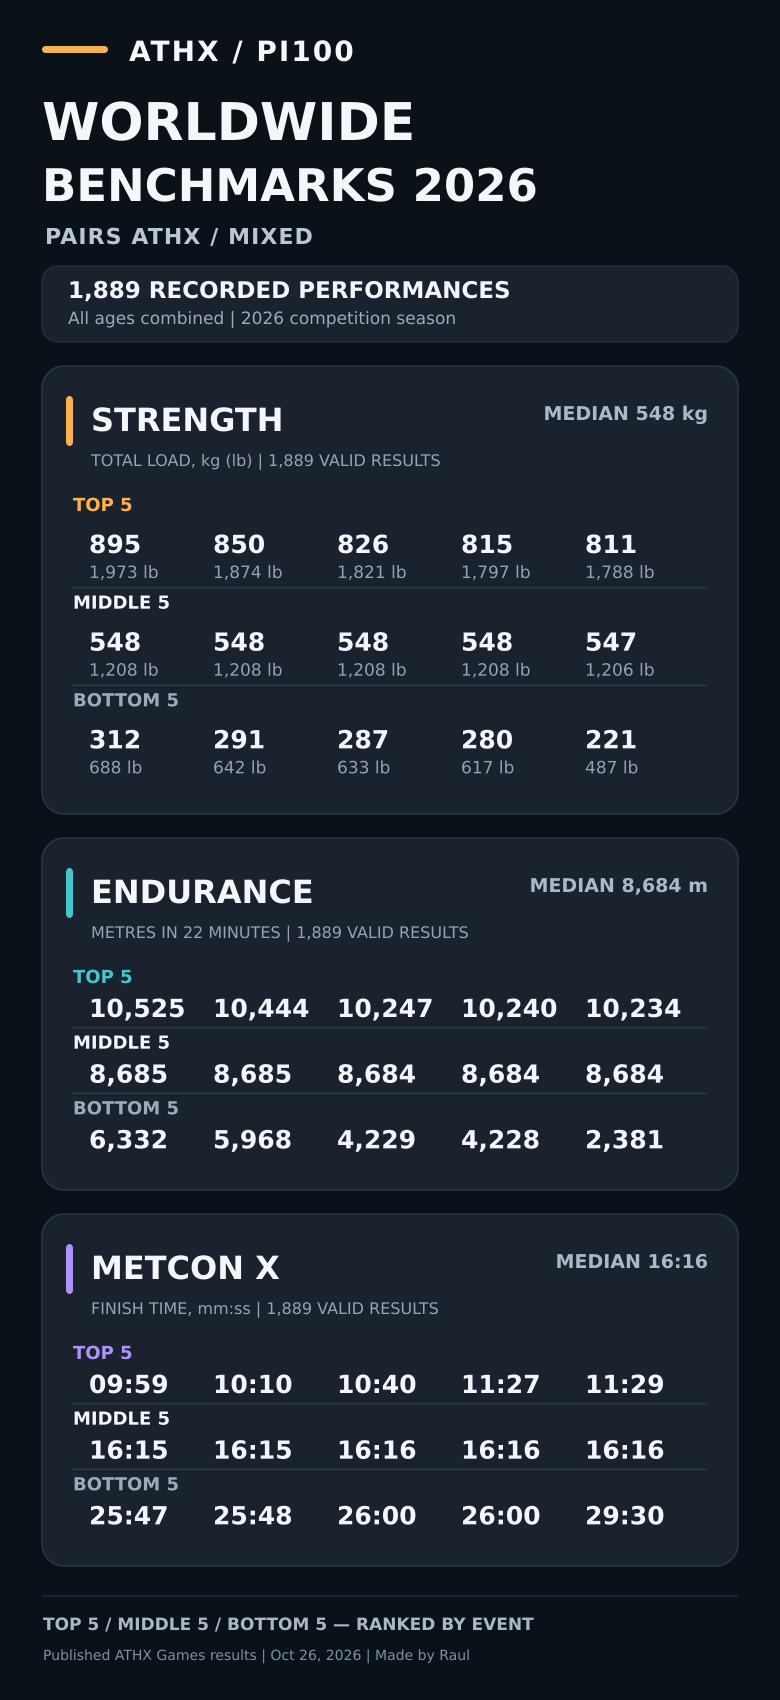
I analyzed 11,063 real results from ATHX competitions in 2026 to give you a better idea of what to expect across strength, endurance, and functional conditioning.
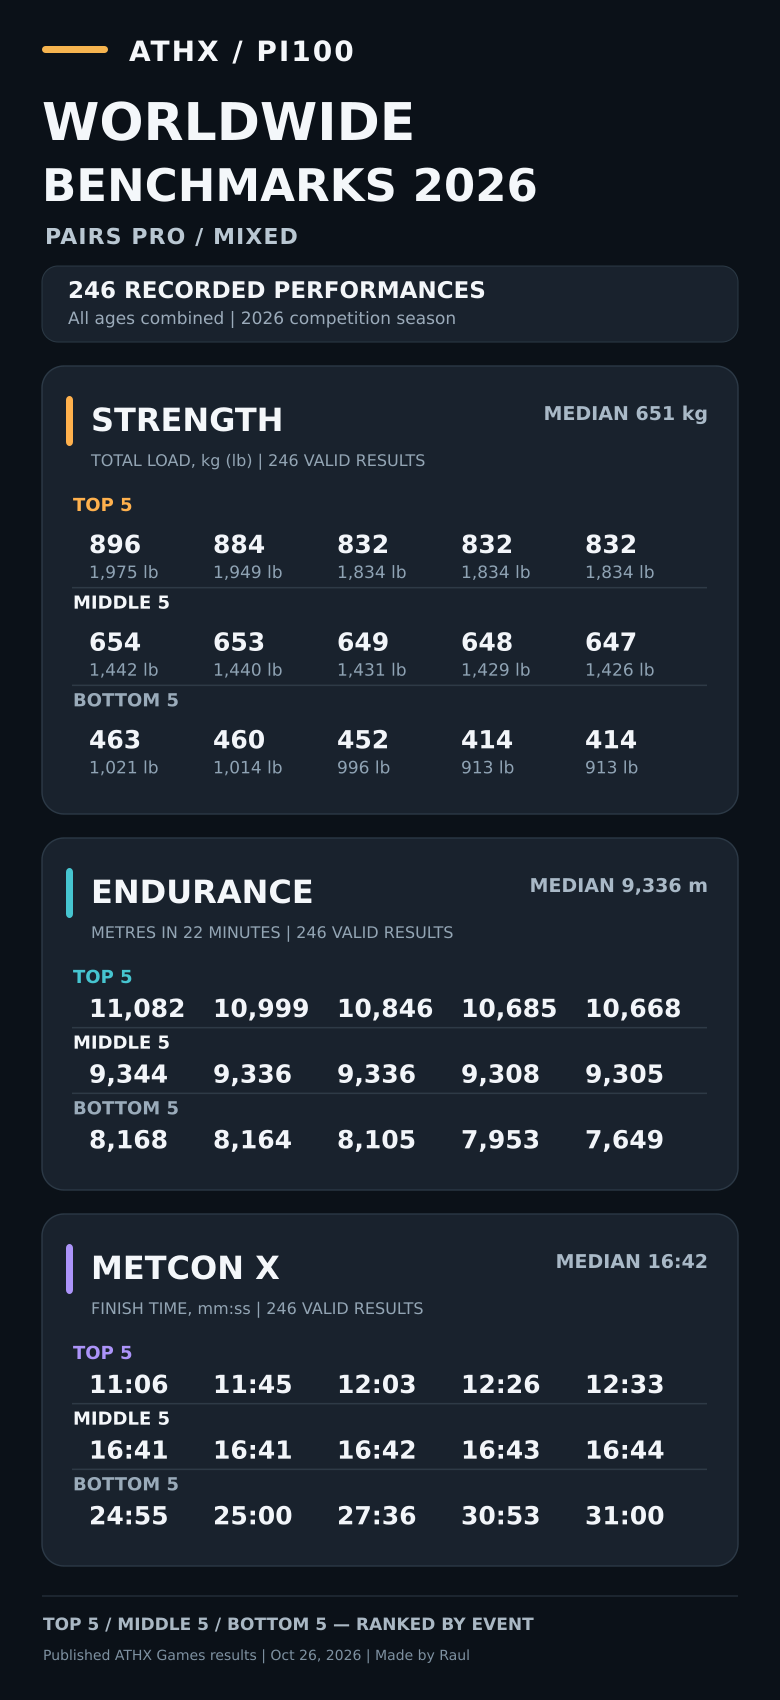
The graphics below cover 13 individual and pairs divisions. For each test, you'll see the Top 5, Middle 5, and Bottom 5 results, with all age groups combined.
These numbers aren't targets you need to beat. They're reference points to help you understand the range of performances and set a goal that makes sense for you.
Sources & Methodology
Data was collected from the official ATHX Games leaderboards for the 2026 season:
Data snapshot: October 26, 2026. The analysis includes 11,063 published performance records across 13 divisions, with all age groups combined. These represent recorded performances, not necessarily unique athletes or pairs.
Results were ranked separately for Strength, Endurance, and MetCon X. The Top 5 represents the best five results, the Middle 5 includes five results around the median, and the Bottom 5 represents the five lowest-performing results.
A small number of clearly anomalous entries were excluded from the affected tests. Strength values were converted from kilograms to pounds and rounded to the nearest pound.
Disclaimer: All data originates from ATHX Games. The benchmarks, visualizations, and PI100 analysis were independently developed by Made by Raul and are not an official ATHX scoring system.